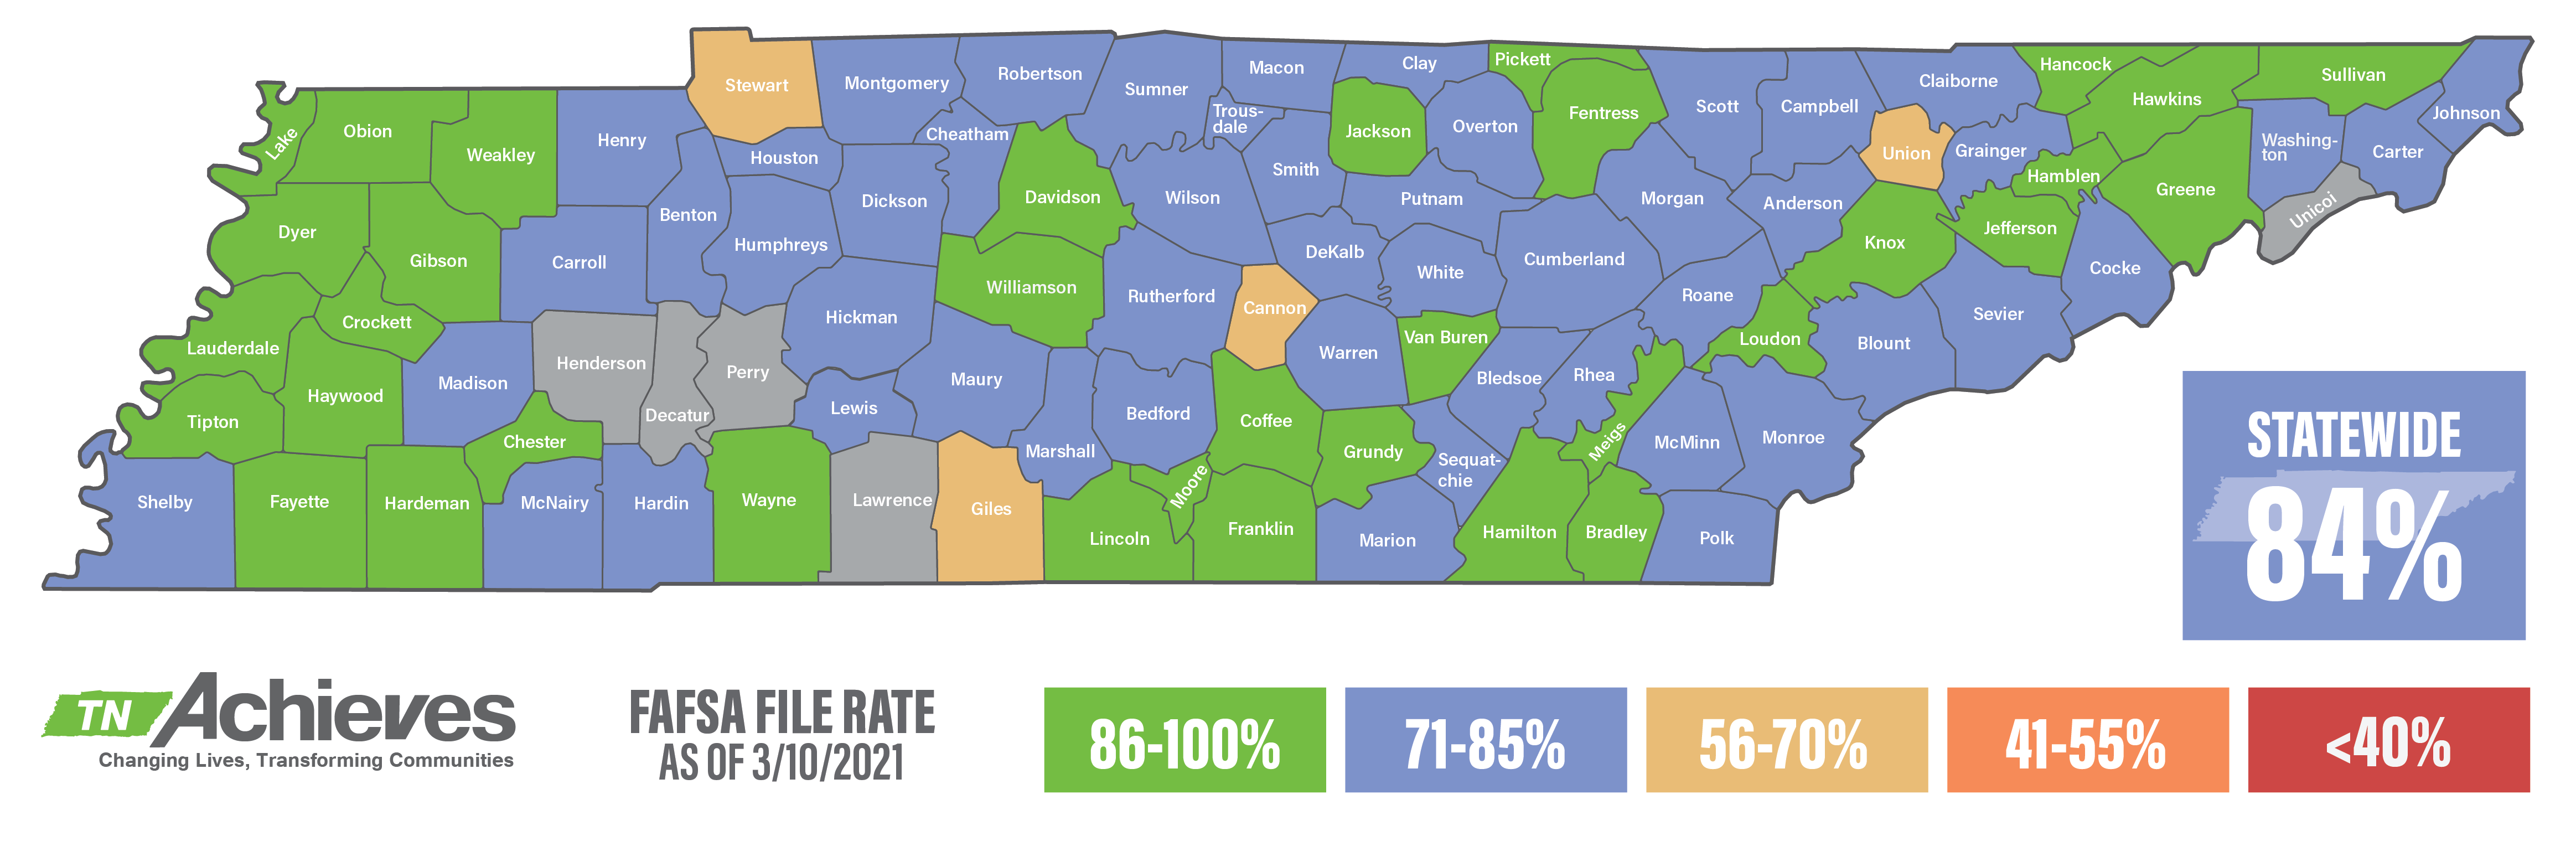
2021-2022 FAFSA Submission Dashboard (County)
The table below represents the percentage of Class of 2021 TN Promise applicants from each county who have submitted their 2021-2022 FAFSA.
The deadline to submit the 2021-2022 FAFSA to remain eligible for TN Promise has been EXTENDED to March 15, 2021.
*2021-2022 FAFSA submission numbers are a reflection of data from eGrands as of 3/10/2021.
| County | TN Promise Applicants | Students Filing FAFSA | FAFSA File Rate |
|
Anderson County |
841 |
717 |
85% |
|
Bedford County |
607 |
466 |
77% |
|
Benton County |
133 |
111 |
83% |
|
Bledsoe County |
117 |
97 |
83% |
|
Blount County |
1220 |
1008 |
83% |
|
Bradley County |
1105 |
951 |
86% |
|
Campbell County |
354 |
294 |
83% |
|
Cannon County |
130 |
84 |
65% |
|
Carroll County |
288 |
223 |
77% |
|
Carter County |
521 |
429 |
82% |
|
Cheatham County |
424 |
322 |
76% |
|
Chester County |
189 |
182 |
96% |
|
Claiborne County |
284 |
236 |
83% |
|
Clay County |
75 |
61 |
81% |
|
Cocke County |
306 |
256 |
84% |
|
Coffee County |
569 |
491 |
86% |
|
Crockett County |
225 |
223 |
99% |
|
Cumberland County |
494 |
350 |
71% |
|
Davidson County |
4103 |
3560 |
87% |
|
DeKalb County |
130 |
105 |
81% |
|
Dickson County |
541 |
420 |
78% |
|
Dyer County |
394 |
365 |
93% |
|
Fayette County |
258 |
224 |
87% |
|
Fentress County |
186 |
164 |
88% |
|
Franklin County |
383 |
347 |
91% |
|
Gibson County |
622 |
599 |
96% |
|
Giles County |
280 |
197 |
70% |
|
Grainger County |
263 |
216 |
82% |
|
Greene County |
705 |
607 |
86% |
|
Grundy County |
145 |
136 |
94% |
|
Hamblen County |
686 |
588 |
86% |
|
Hamilton County |
2663 |
2380 |
89% |
|
Hancock County |
51 |
48 |
94% |
|
Hardeman County |
235 |
210 |
89% |
|
Hardin County |
259 |
193 |
75% |
|
Hawkins County |
515 |
447 |
87% |
|
Haywood County |
208 |
183 |
88% |
|
Henry County |
264 |
213 |
81% |
|
Hickman County |
248 |
202 |
81% |
|
Houston County |
81 |
59 |
73% |
|
Humphreys County |
182 |
148 |
81% |
|
Jackson County |
92 |
82 |
89% |
|
Jefferson County |
458 |
400 |
87% |
|
Johnson County |
141 |
120 |
85% |
|
Knox County |
4295 |
3740 |
87% |
|
Lake County |
49 |
42 |
86% |
|
Lauderdale County |
288 |
266 |
92% |
|
Lewis County |
111 |
86 |
77% |
|
Lincoln County |
363 |
327 |
90% |
|
Loudon County |
481 |
412 |
86% |
|
Macon County |
220 |
180 |
82% |
|
Madison County |
862 |
613 |
71% |
|
Marion County |
303 |
228 |
75% |
|
Marshall County |
376 |
309 |
82% |
|
Maury County |
784 |
667 |
85% |
|
McMinn County |
423 |
324 |
77% |
|
McNairy County |
312 |
265 |
85% |
|
Meigs County |
127 |
114 |
90% |
|
Monroe County |
415 |
298 |
72% |
|
Montgomery County |
1704 |
1374 |
81% |
|
Moore County |
80 |
74 |
93% |
|
Morgan County |
205 |
163 |
80% |
|
Obion County |
317 |
273 |
86% |
|
Overton County |
236 |
189 |
80% |
|
Pickett County |
42 |
37 |
88% |
|
Polk County |
154 |
133 |
86% |
|
Putnam County |
709 |
581 |
82% |
|
Rhea County |
331 |
237 |
72% |
|
Roane County |
476 |
371 |
78% |
|
Robertson County |
750 |
593 |
79% |
|
Rutherford County |
3366 |
2762 |
82% |
|
Scott County |
277 |
209 |
75% |
|
Sequatchie County |
148 |
114 |
77% |
|
Sevier County |
962 |
804 |
84% |
|
Shelby County |
8010 |
6339 |
79% |
|
Smith County |
199 |
155 |
78% |
|
Stewart County |
112 |
76 |
68% |
|
Sullivan County |
1440 |
1245 |
86% |
|
Sumner County |
2229 |
1845 |
83% |
|
Tipton County |
728 |
648 |
89% |
|
Trousdale County |
89 |
70 |
79% |
|
Union County |
186 |
120 |
65% |
|
Van Buren County |
58 |
55 |
95% |
|
Warren County |
451 |
383 |
85% |
|
Washington County |
937 |
789 |
84% |
|
Wayne County |
159 |
152 |
96% |
|
Weakley County |
174 |
153 |
88% |
|
White County |
249 |
208 |
84% |
|
Williamson County |
2983 |
2788 |
93% |
|
Wilson County |
1694 |
1431 |
84% |
|
TOTAL |
60841 |
50956 |
84% |